flowchart TB
  A["Same underlying change<br/>20 out of 100 → 30 out of 100"]

  A --> B["Proportion<br/>0.20 → 0.30<br/>What share of the group?"]
  A --> C["Percentage<br/>20% → 30%<br/>Same share on a 0–100 scale"]
  A --> D["Percentage-point change<br/>+10 percentage points<br/>How far did the percent move?"]
  A --> E["Relative comparison<br/>0.30 ÷ 0.20 = 1.5×<br/>How large is the new value compared with the old one?"]
9 Ratios, Proportions & Percentages
9.1 Ice-Nine and Other Things That Spread: Ratios, Percentages, and Public Understanding
In Cat’s Cradle, ice-nine is dangerous because once it appears, it does not stay contained. A small crystal becomes a chain reaction. Numerical framing can behave in much the same way in public health. A phrase like “risk doubled” or “cases rose by 50%” is compact, vivid, and easy to repeat, which makes it useful when people need a quick summary. It also means that a partial description can spread faster than the understanding needed to interpret it.
The challenge is not that ratios, proportions, and percentages are advanced mathematics. It is that several descriptions of the same change can all be correct at once while doing very different rhetorical work. One version may sound calm, another may sound dramatic, and a third may sound more precise than it really is. The reader needs a way to sort out what kind of statement is being made before deciding what the statement means.
One change, four different questions
Start with one fixed example and keep it still. In one clinic, vaccination coverage rises from 20 out of 100 people to 30 out of 100 people. Nothing else changes. The population is the same, the outcome is the same, and the underlying shift is simple: 10 more people in that clinic are vaccinated.
Once the example is held still, the language around it becomes easier to separate. A proportion answers the question, what share of the group has the characteristic? In this case, the share moves from 20/100 to 30/100, or from 0.20 to 0.30. A percentage answers that same question on a more familiar scale, so the exact same shift can be written as 20% to 30%. Nothing new has been discovered there. The information has just been translated into the form people are most used to seeing.
Now ask a different question. Instead of asking about the share itself, ask how far the percent scale moved. From 20% to 30% is a change of 10 percentage points. That phrase matters because percentage points are often confused with percent increase, even though they are not answering the same question. Percentage points tell you the size of the gap on the percent scale. They do not tell you how large the later value is compared with the earlier one.
That last question brings us to ratio and relative increase. If the earlier proportion is 0.20 and the later proportion is 0.30, then 0.30 divided by 0.20 is 1.5. The later level is therefore 1.5 times the earlier one. The same fact can also be described by saying the later level is 50% higher than baseline. Again, that is mathematically correct. But it is a different kind of statement. It is no longer describing the share directly or the size of the percent-scale gap. It is describing how large the new value is relative to where things started.
The reason people get tangled up here is not that one of these descriptions is wrong. The problem is that they are easy to slide between without noticing that the question has changed. “Coverage increased from 20% to 30%,” “coverage increased by 10 percentage points,” and “coverage increased by 50%” can all describe the same underlying reality. But they do not place the reader’s attention in the same place. One keeps the original levels visible. One emphasizes the gap on the percent scale. One emphasizes the size of the change relative to baseline.
Why “50% higher” can sound larger than the underlying change
Relative language is often the most rhetorically powerful version because it makes the change sound attached to motion rather than to level. If an outcome rises from 2 in 1,000 to 3 in 1,000, it is still true that the outcome increased by 50%. The ratio is still 1.5. But many readers will react differently to “up by 50%” than to “up from 2 in 1,000 to 3 in 1,000,” even though those sentences are mathematically describing the same event.
That does not make relative language dishonest by default. Sometimes it is exactly the right frame, especially when the point is to compare how sharply one condition differs from another. The problem starts when relative language is allowed to stand alone. Once the baseline disappears, the audience loses the anchor that keeps the change in proportion. A 50% increase can describe something still rare, something now common, or something already severe becoming more severe. The ratio does not tell you which of those worlds you are in.
This is why the most reliable reading habit is not simply “look for the denominator,” because the previous section already made that point. Here the more important question is: what kind of claim am I hearing right now? Is this sentence telling me the level, the gap, or the relative change from baseline? Until that is clear, it is easy to overreact to a dramatic framing or to underestimate an important one.
Why the same percentage change can still mean different burden
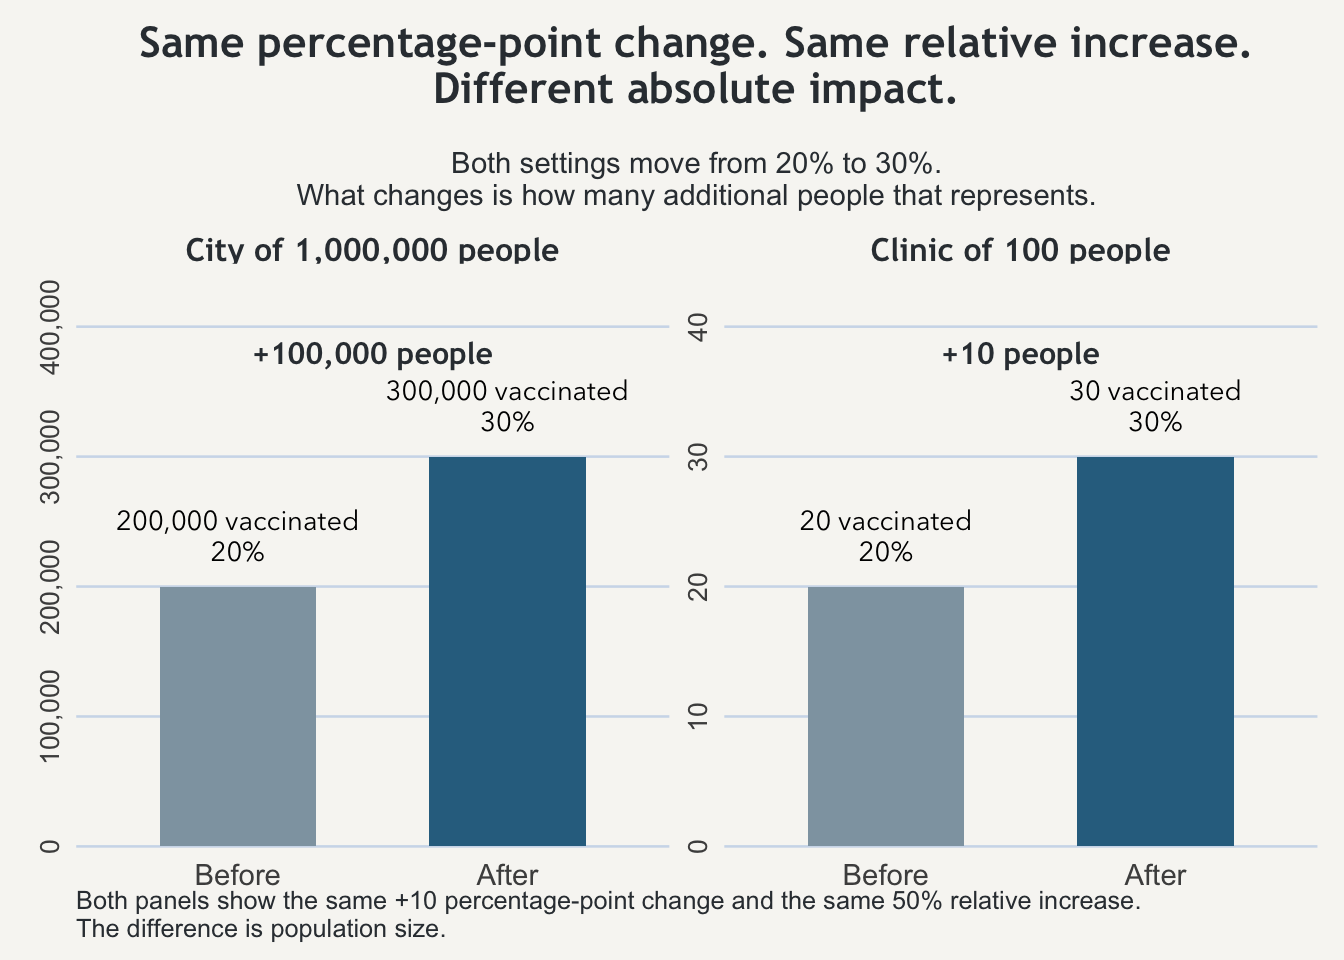
Even after you sort out share, percentage points, and relative change, there is still one more translation step that matters in practice. Two places can show the same movement in percentage terms and the same relative increase, yet the real-world burden can be very different because the populations underneath those percentages are different sizes.
That is the purpose of the figure below. In both settings, the share rises from 20% to 30%. In both settings, the shift is 10 percentage points. In both settings, the later level is 1.5 times the earlier one, which is the same as a 50% relative increase. But one setting represents 100 people and the other represents 1,000,000. The mathematical descriptions of change stay the same while the number of additional affected people changes dramatically.
This is the point where reporting usually needs translation rather than just repetition. A percentage may be the right way to compare groups. A ratio may be the right way to describe how sharply something changed. But once a decision has to be made in the world of actual people, actual staff, actual beds, or actual vaccines, the abstract description has to come back down to count. Otherwise the audience may understand the direction of the change without understanding its practical scale.
The habit worth keeping
The most useful habit from this page is not memorizing the labels. It is learning to pause and ask what kind of comparison a sentence is making. Is it telling you the share within a group? Is it telling you how far the percent scale moved? Is it telling you how much larger the new level is than the old one? Or is it translating all of that into how many additional people are actually affected?
Once you know which question is being answered, the numbers become easier to read and harder to weaponize. That is the real value of keeping proportion, percentage, percentage-point change, and relative comparison distinct. They are not competing truths. They are different ways of looking at the same underlying change, and public understanding gets distorted when one of those views is mistaken for all the others.
Takeaway
A proportion tells you the share within a group, a percentage writes that same share on a 0–100 scale, percentage points tell you how far the percent scale moved, and a ratio tells you how large the new value is compared with the old one. The important habit is learning which of those questions a sentence is actually answering.