18 Confidence With Numbers
18.1 Maybe God Isn’t Omnipotent. Maybe He’s Just Been Around So Long He Knows Everything.
The alarm goes off to the same song. The same voices on the radio push the same forced cheer into the room. Outside, the same little town waits in the same winter light. A man slips on the street. Someone asks the same question. Another person appears at the same corner at almost the same moment as yesterday. At first that kind of repetition would feel eerie. After enough mornings, it would start to feel like information.
Once the shock wears off, the repeated day separates into layers. Some things happen almost every time. Some happen often enough to anticipate, but not perfectly. Some stay noisy no matter how familiar the setting becomes. That is the part of Groundhog Day that belongs here. Phil does not become omniscient. He becomes calibrated. He gets harder to surprise because he has seen the same process play out again and again.
That is also the bargain statistics makes with repeated observation. If the process underneath what you are recording is genuinely stable, repetition makes your summary less fragile. It does not make the world stop varying. It does not turn the next single outcome into a guarantee. It narrows how much random bounce can push your estimate around.
Imagine one clinic with a stable scheduling system, the same basic patient mix most days, and the same definition of what counts as waiting time. Some patients are roomed quickly. Some wait a while. A few wait much longer than anyone would like. The waiting times themselves are spread out. The real question is what repeated observation does to your understanding of that spread.
What repeated observation buys you
Start recording waits from that clinic one patient at a time and the average is easy to shove around. One unusually short wait or one ugly outlier can move it a lot. Keep recording from the same process and that average still moves, but less and less. The long-run summary starts to settle even though the individual waits never stop bouncing. That is the practical form of the law of large numbers: not a ceremonial theorem name, but a reason to distrust tiny early samples and to treat later summaries as harder to knock off center.
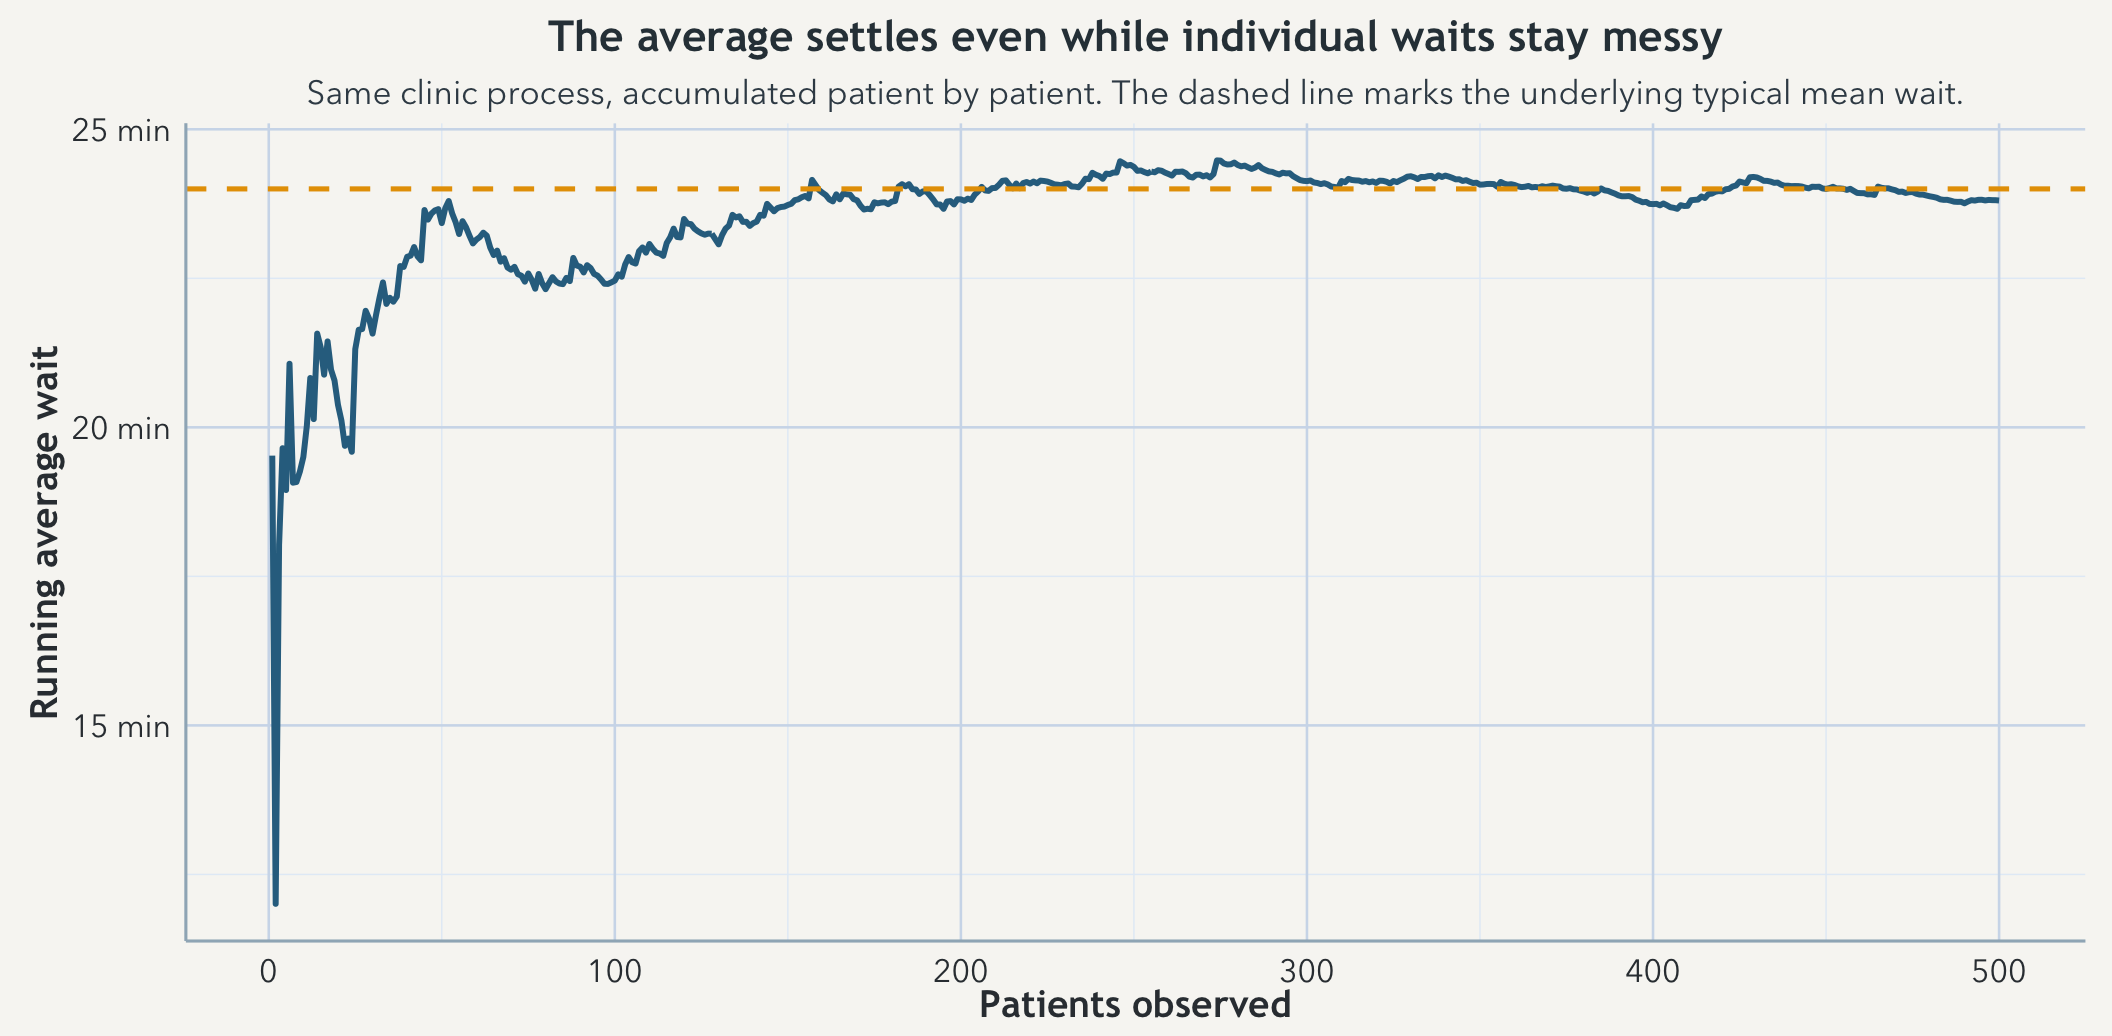
The word same is doing real work there. This settling is not a reward for merely having a larger spreadsheet. It depends on repeated observation of the same kind of process. If staffing changes, triage rules change, the appointment mix shifts, or the definition of waiting time moves underneath you, then the average may still stabilize numerically while answering a different question than it did before.
Spread in people and uncertainty in the estimate are different problems
The most useful distinction on this page is not between two formulas. It is between two kinds of variability. One lives in the clinic itself: patients really do have very different waits. The other lives in your summary: if you kept taking new samples from the same clinic, the estimated mean would wobble from sample to sample.
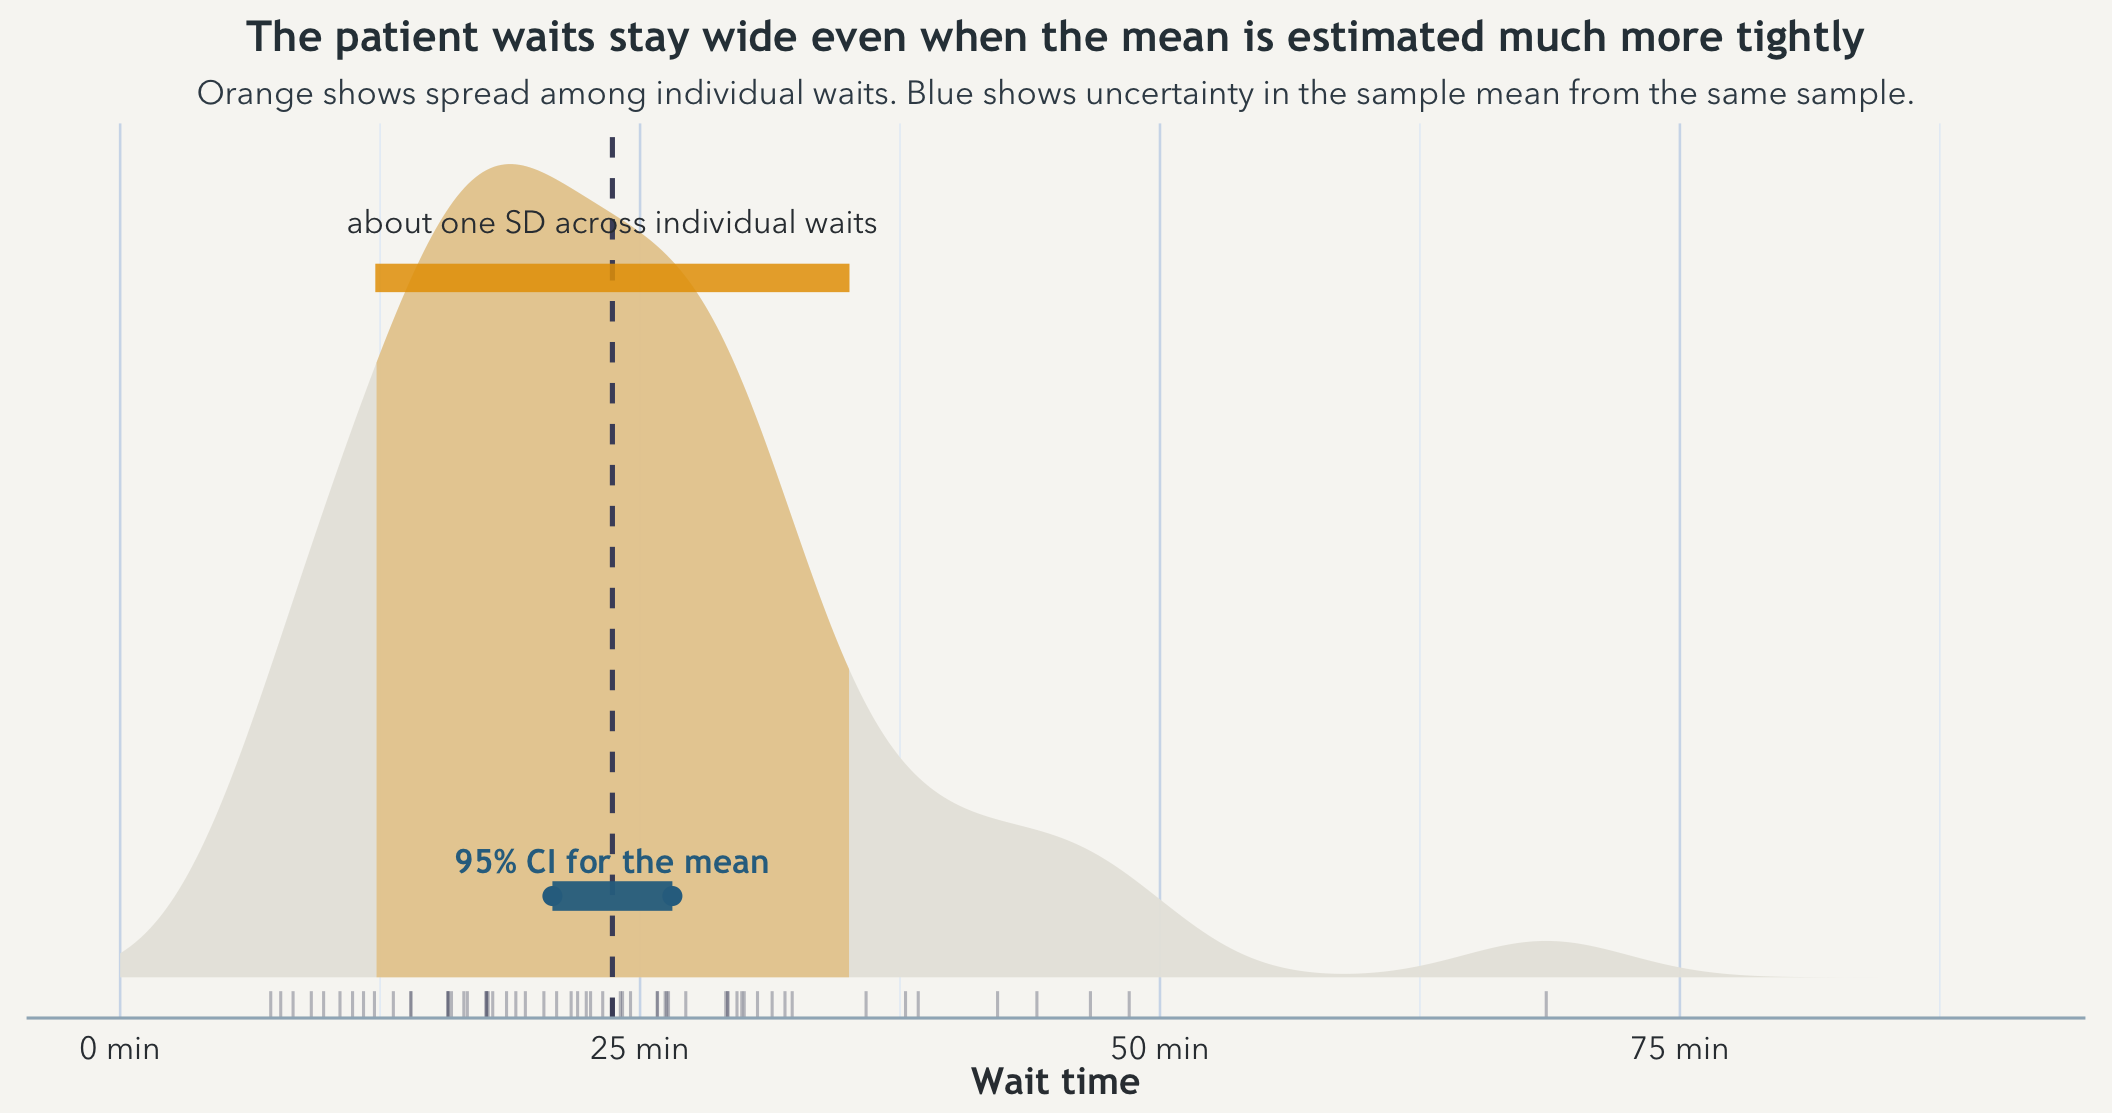
Suppose the clinic’s patient-to-patient standard deviation is about 12 minutes. With a sample of 25 patients, the standard error of the mean is about 12 / sqrt(25) = 2.4 minutes, so a rough 95% margin of error is about 1.96 x 2.4 ≈ 4.7 minutes. Push the sample to 100 patients and the standard error drops to about 1.2 minutes, with a margin of error around 2.4 minutes. The patients did not become more alike. The estimate simply became less fragile.
A density view makes that easier to see because it preserves the shape of the waits instead of reducing them to a cloud of points. The orange region marks about one standard deviation of individual waits around the sample mean. The blue interval is much narrower because it is uncertainty in the mean, not the spread of patient experiences.
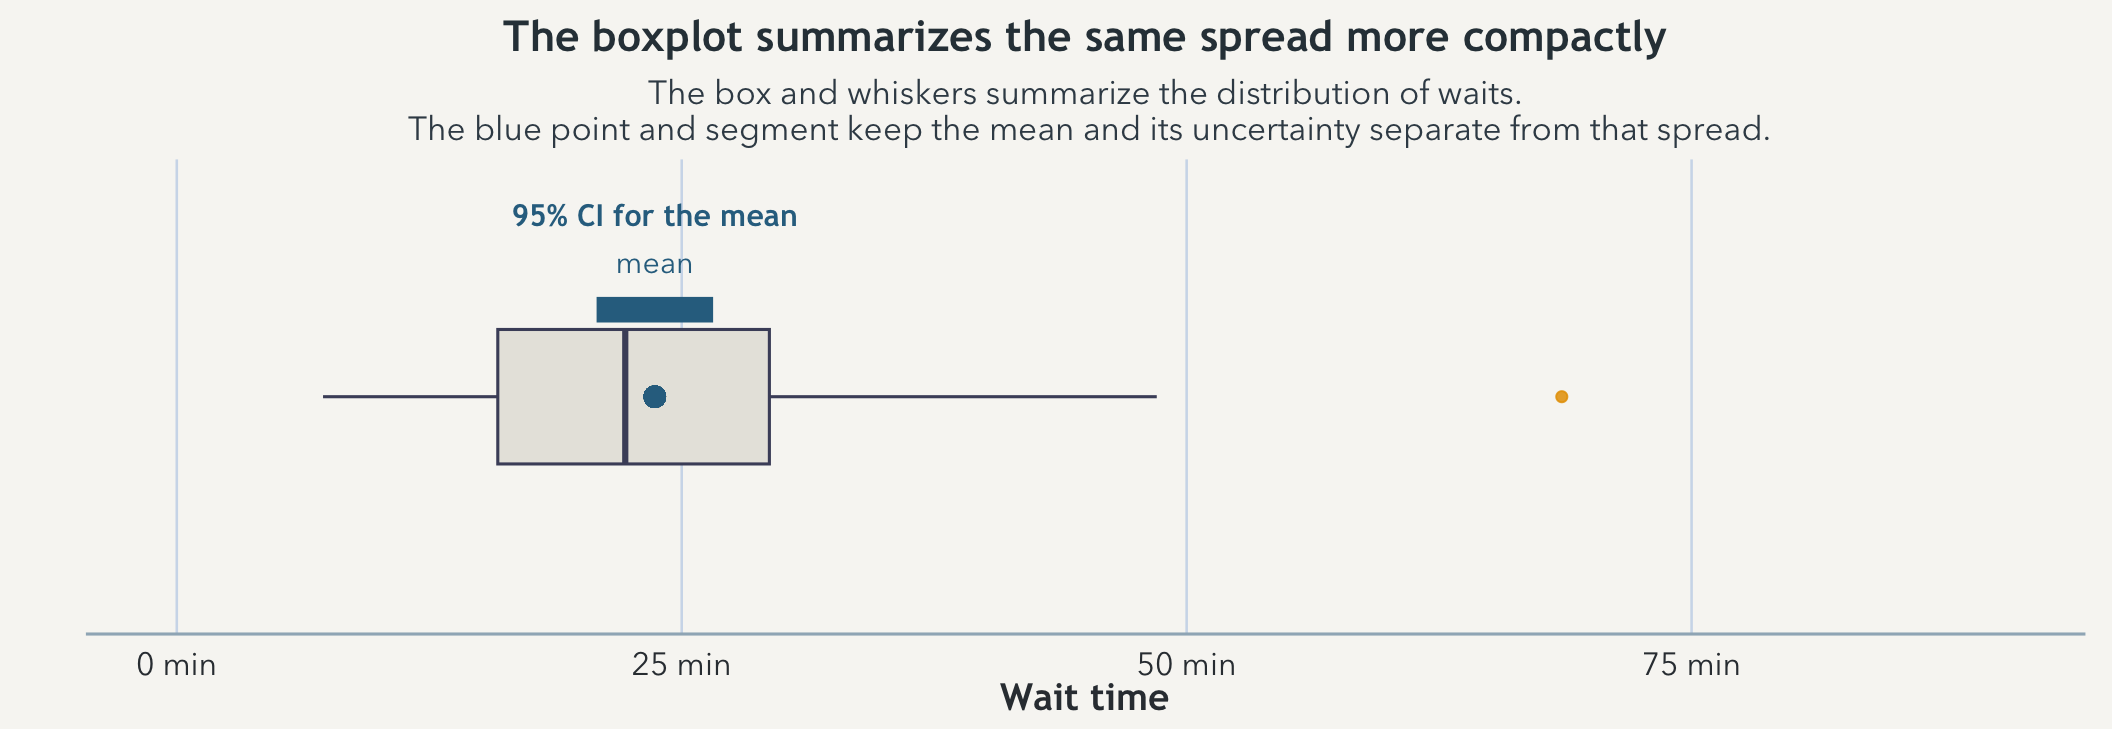
A box-and-whisker view compresses the same sample into a smaller summary. It is useful for seeing median, quartiles, and unusually long waits quickly, but it is less good than the density at showing the lived shape of the spread. That is why it works best here as a companion rather than a replacement.
That is what confidence is trying to discipline. A confidence interval for the mean is not a claim about where most individual patients fall. It is a claim about how much the estimated mean would tend to wander if you kept resampling from the same underlying clinic process. Spread in the world and uncertainty in the estimate are related, but they are not the same thing and they should not be read as if they were.
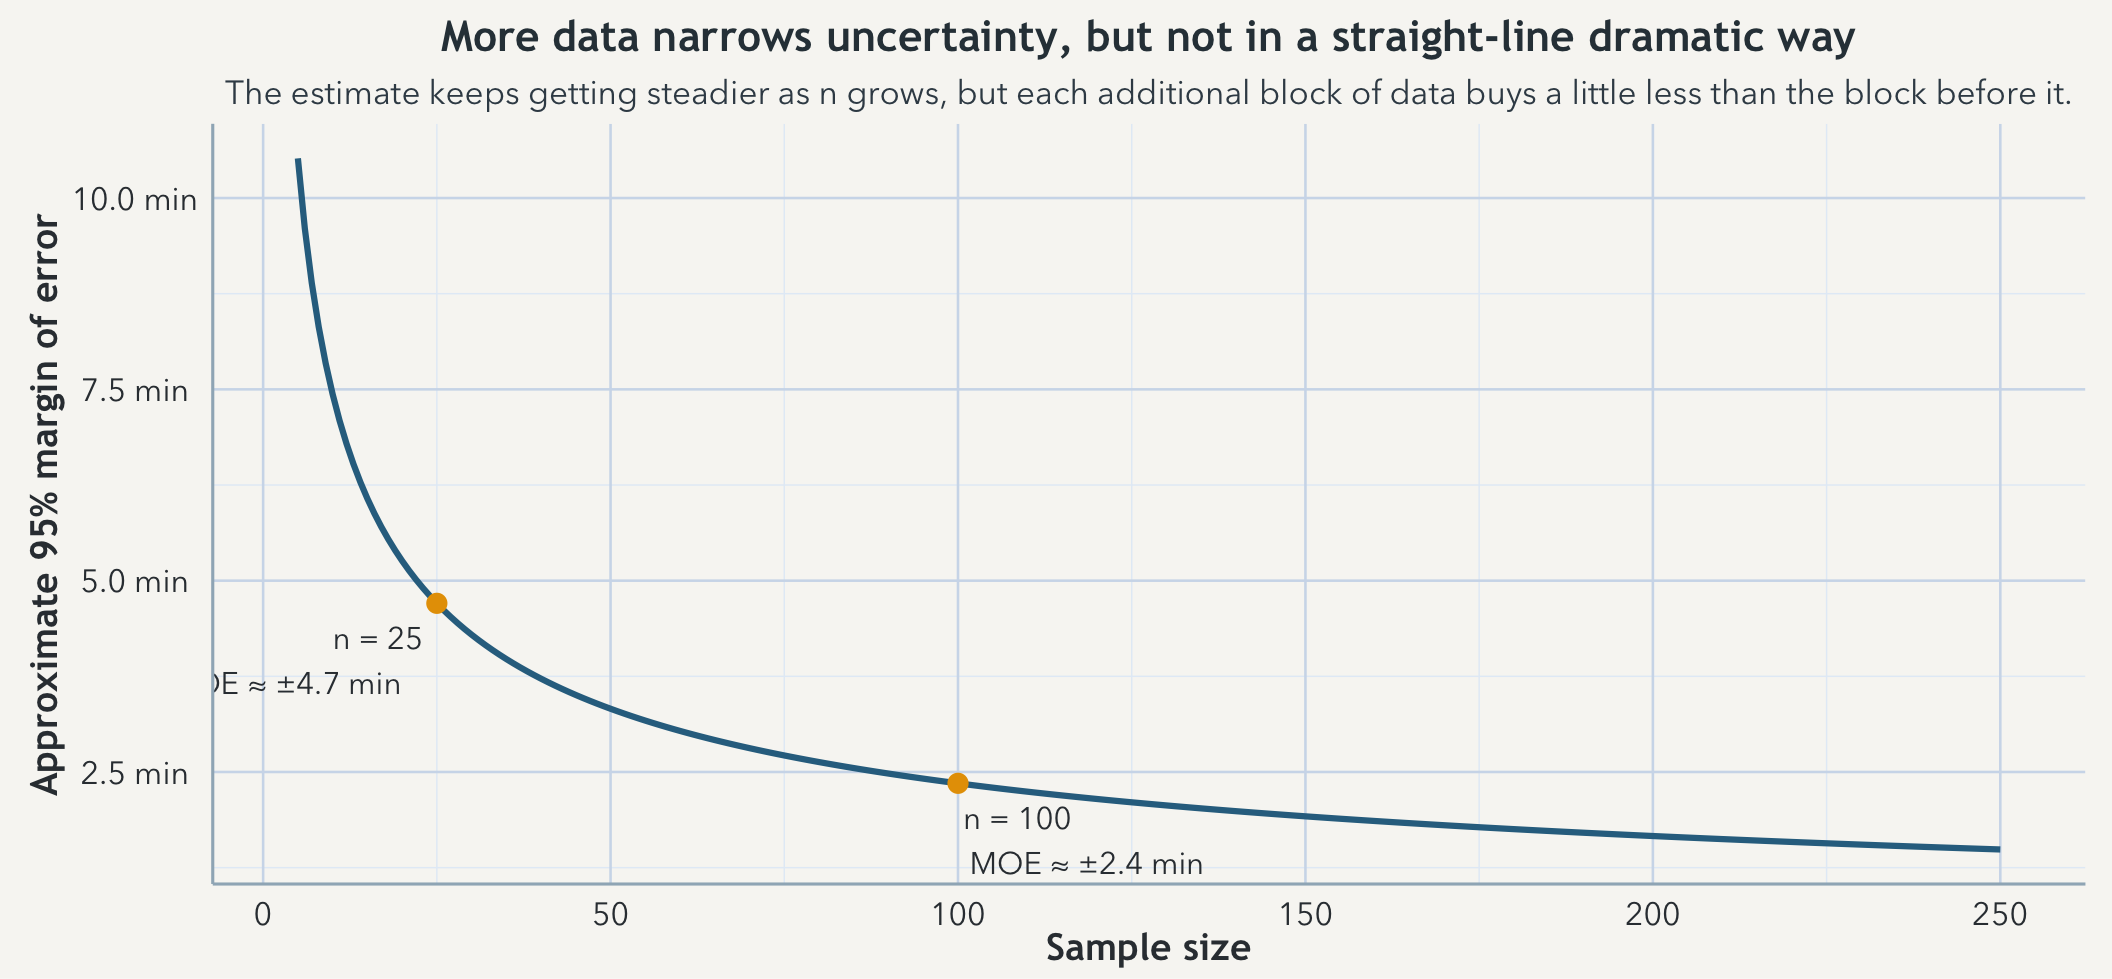
That slow curve matters because people routinely imagine that doubling the data should nearly double the certainty. It does not. The interval shrinks with the square root of the sample size. You have to work much harder for each further reduction in wobble.
Why averages become easier to work with than the raw waits that produce them
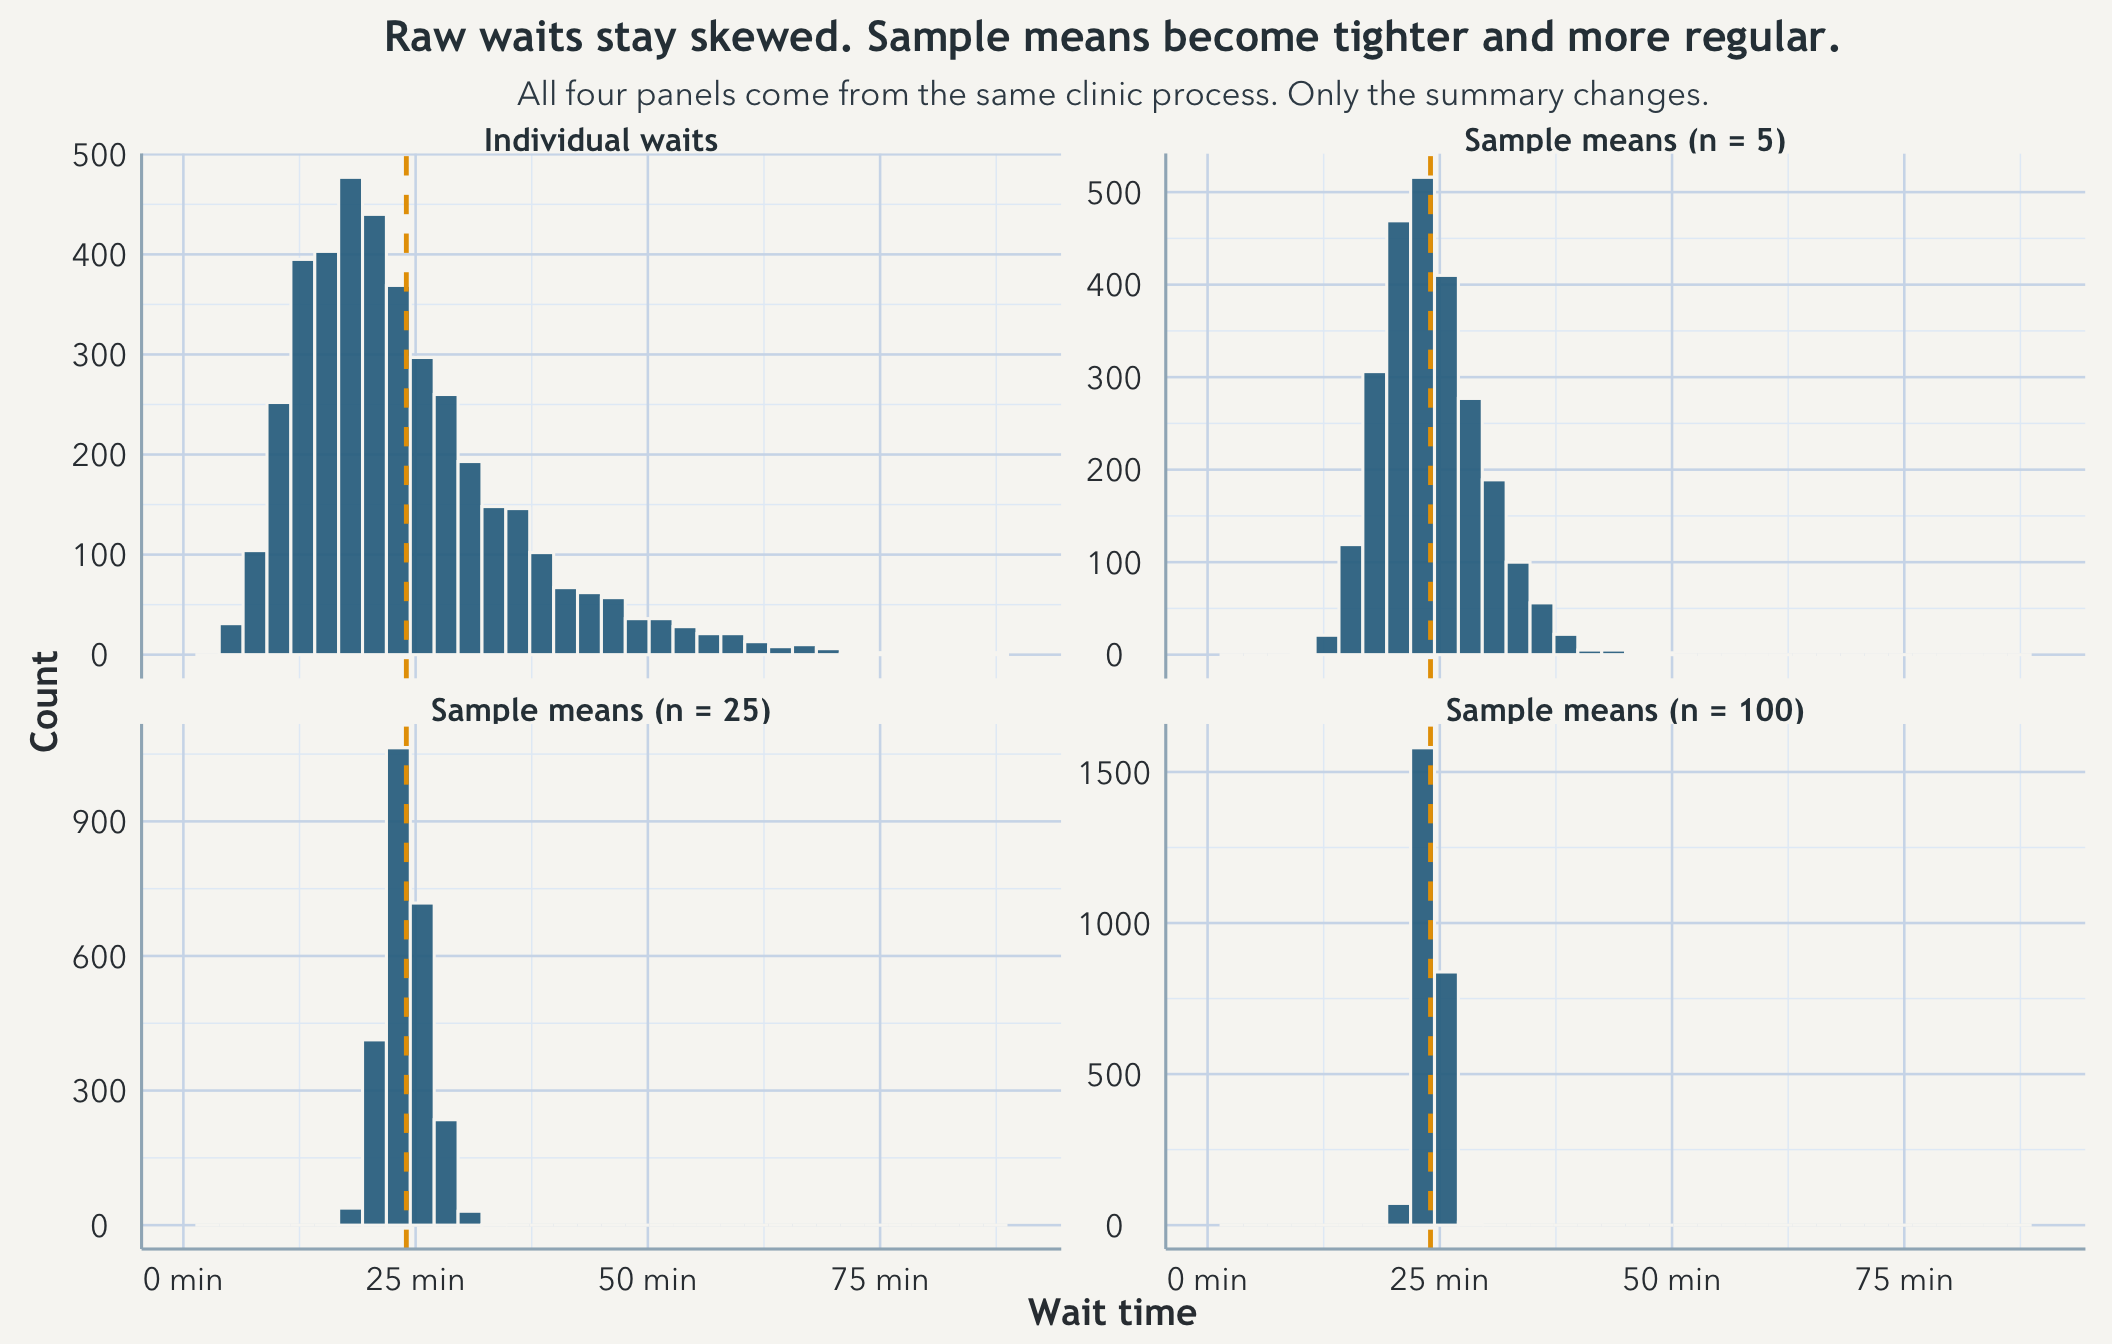
The clinic waits themselves can stay right-skewed because a few long waits really do happen. But repeated sample means from that same clinic behave more regularly than the raw waits do. Draw many samples of size 5 and average each one, then do the same for samples of size 25 and 100. The raw process stays lopsided. The means pull inward and become more bell-shaped. That is the central limit theorem in the form most people actually use it: repeated averages are easier to summarize, compare, and wrap intervals around than the individual observations they came from.
None of that means the clinic has become simpler than it really is. It means averages have a more cooperative long-run shape than individual waits do. That is why confidence intervals and standard errors so often ride on mean-based summaries. The statistics are not claiming that the raw world is bell-shaped. They are claiming that repeated summaries of a stable process often behave in a way that is much easier to work with.
That brings the chapter back to the repeated day. Familiarity earns better calibration only when you are still seeing the same underlying world. Change the process and yesterday’s repetition stops buying today’s confidence. A narrower interval around the wrong target is still wrong.
Takeaway
Repeated observation of the same stable process can make your claims more confident because the estimate becomes less sensitive to random bounce, even while the individual outcomes remain messy. That is why long-run averages settle, why repeated sample means become easier to work with, and why confidence intervals narrow as more data accumulate. The confidence belongs to the summary, not to any single next outcome, and it only deserves that name if you are still measuring the same kind of world.