flowchart TB
  A["Same underlying week<br/>Town of 1,000 residents"]

  A --> B["Prevalence on Monday 1<br/>12 current cases<br/>12/1,000 = 1.2%"]
  A --> C["Incidence during the week<br/>18 new cases<br/>18/1,000 = 1.8% over 7 days"]
  A --> D["Prevalence on Monday 2<br/>20 current cases<br/>20/1,000 = 2.0%"]
  A --> E["Rate statement<br/>18 new cases per 1,000 residents per week<br/>Time is part of the statistic"]
10 Rates, Prevalence & Incidence
10.1 I Was a Victim of a Series of Accidents, as Are We All: Rates, Prevalence, and Timing
Public health almost never asks only how many (And neither should you anymore). It usually has to ask how many currently, how many new, and over what period. Those are not stylistic differences. They are different questions, and once the clock changes, the meaning of the number changes with it.
That is why incidence, prevalence, and rate are easy to blur together in ordinary speech but dangerous to blur together in analysis. They often describe the same underlying problem, yet they do not locate that problem in the same way. One tells you about new arrival. One tells you about current burden. One is not complete unless the time unit is stated out loud.
One town, one week, three different questions
Start with one fixed example and keep it still. In a town of 1,000 residents, 12 people are currently ill on Monday morning. Over the next seven days, 18 additional residents become newly ill. During that same week, 10 current cases recover or otherwise stop being counted as active cases. By the following Monday morning, 20 residents are currently ill.
Nothing about that week needs to change for the language around it to change. If the question is how many people are currently affected right now, the answer on the first Monday is 12 out of 1,000, or 1.2% prevalence. On the second Monday, the answer is 20 out of 1,000, or 2.0% prevalence. Prevalence is about the share of the population currently carrying the condition at a specified point in time.
If the question is how many new cases occurred during the week, the answer is 18. That is incidence (A new incident of): new cases entering the system over a stated interval. The incidence proportion for that week is 18 out of 1,000, or 1.8%, if we are using the full town as the reference population for this simplified example. The point is not the formula alone. The point is that incidence is tied to entry, not to current occupancy.
If the question is how fast were new cases appearing, the answer has to include the clock. You might write it as 18 new cases per 1,000 residents per week, or equivalently 180 new cases per 10,000 residents per week. That is the rate-style statement. The numerator still comes from new cases, but now the wording makes explicit that time is part of the quantity rather than an afterthought.
The reason people get tangled up here is that each sentence is attached to the same real week, but each is answering a different question. Prevalence does not ask how many cases appeared. Incidence does not ask how many cases are still present right now. A rate does not become interpretable until the time unit is attached. If those questions are not kept separate, the reader may think two statistics disagree when they are really describing different parts of the same process.
Why one illness episode behaves differently in incidence and prevalence
The same person can affect incidence and prevalence, but not in the same way and not for the same length of time. When someone first becomes a case, incidence increases because a new event has happened. Prevalence also increases because there is now one more person currently in the affected group. After that point, the paths separate. If the person remains ill for several days or several years, prevalence stays elevated for as long as the case remains current. Incidence does not keep rising from that same episode. It already recorded the entry.
flowchart LR
  A["A person becomes newly ill"] --> B["Incidence +1<br/>because a new case occurred"]
  A --> C["Prevalence +1<br/>because one more person is currently affected"]
  C --> D["The person remains an active case"]
  D --> E["Recovery, death, or other resolution"]
  E --> F["No longer counted in current prevalence"]
  B --> G["That same episode does not create another new case later"]
That is the entire conceptual difference in compact form. Incidence records entry into the case count. Prevalence records how much illness the system is carrying at the moment you look. Once you see that, a lot of apparently confusing reporting becomes easier to read. A condition can have modest incidence but high prevalence if people live with it for a long time. A condition can also show a sharp incidence spike without producing the same long-lasting prevalence burden if cases resolve quickly.
Why the time unit cannot be dropped
This is where ordinary language causes the most trouble. People often say “the rate was 50 per 100,000” as though the statement were complete. It is not. Fifty per 100,000 per year and fifty per 100,000 per week are not slightly different versions of the same claim. They describe very different worlds.
The same problem appears when reports compare places or periods without matching the clock. A monthly rate cannot be directly compared with an annual rate unless the time frame is made explicit and the values are put onto a common scale. Time is not decoration attached after the number is computed. It is part of what the number is.
The most reliable reading habit here is simple: when you see the word rate, ask where the time unit went. If the statement does not tell you whether the statistic is per day, per week, per month, or per year, then the sentence is unfinished.
Why current burden can stay high after new cases begin to fall
The figure below uses the same town and the same basic logic over several weeks. The bars show new cases appearing each week. The line shows active cases still being carried by the town after accounting for recoveries. New cases rise first, but active burden does not instantly disappear when new cases begin to slow. It falls only when exits begin catching up with entries.
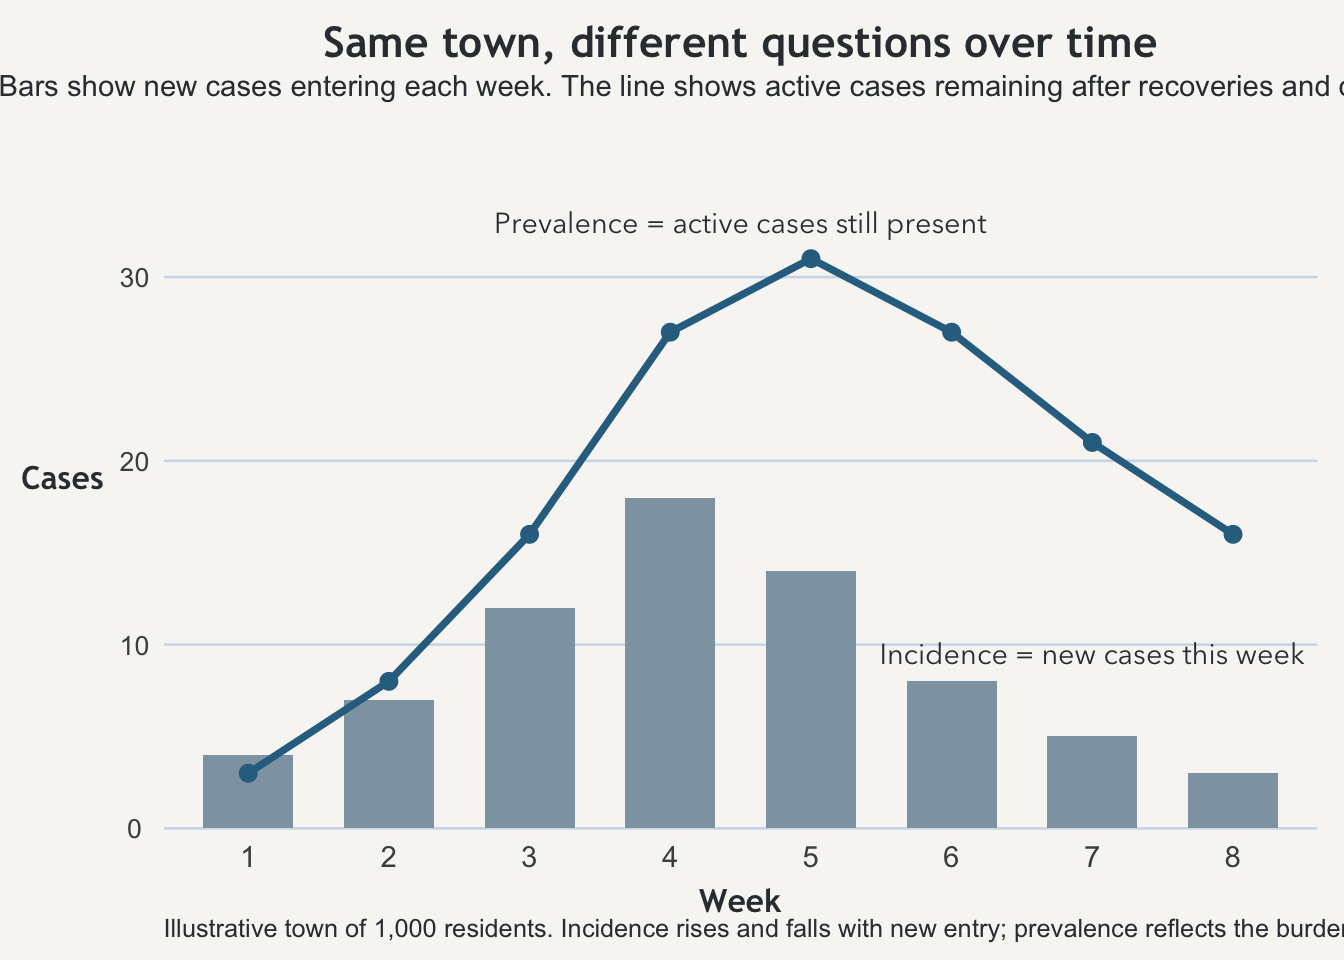
That distinction matters in practice because systems are strained by current burden, not just by arrival speed. Hospitals, clinics, case managers, isolation space, and medication supply all care about how many people are currently being carried at once. An epidemic curve can begin bending downward while the burden on the system remains substantial. Incidence tells you the pace of new accumulation. Prevalence tells you what is still in the building.
The habit worth keeping
The useful habit from this page is not just memorizing two definitions. It is learning to ask what part of the process the number is attached to. Is the statistic counting new entry into the condition? Is it counting the current stock of people already in it? Is it trying to compare populations over time, in which case the clock has to be part of the statement itself?
Once those questions are explicit, incidence, prevalence, and rate stop sounding like near-synonyms and start behaving like distinct tools. They belong to the same story, but they do not answer the same question.
Takeaway
Incidence tracks new cases over a stated interval. Prevalence tracks current burden at a specified point or over a specified window. A rate is not complete unless the time unit is named. The important habit is to ask whether a sentence is describing new arrival, current burden, or the speed of change over time.